Chart of the Month: Intra-Year Declines
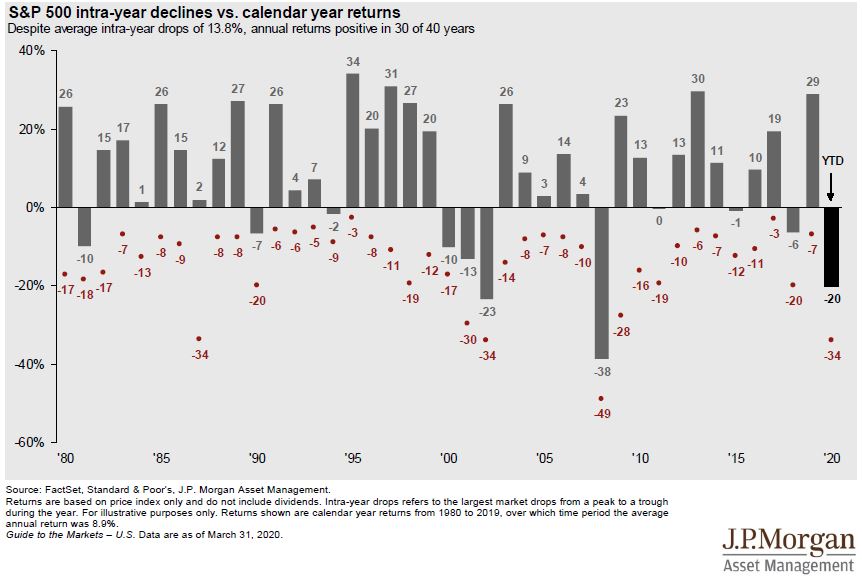
Chart of the Month: Intra-Year Declines In an effort to find perspective around market volatility, we look to a chart that J.P. Morgan updates every quarter tracking intra-year declines. This [...] READ MORE >
Chart of the Month: Intra-Year Declines In an effort to find perspective around market volatility, we look to a chart that J.P. Morgan updates every quarter tracking intra-year declines. This [...] READ MORE >
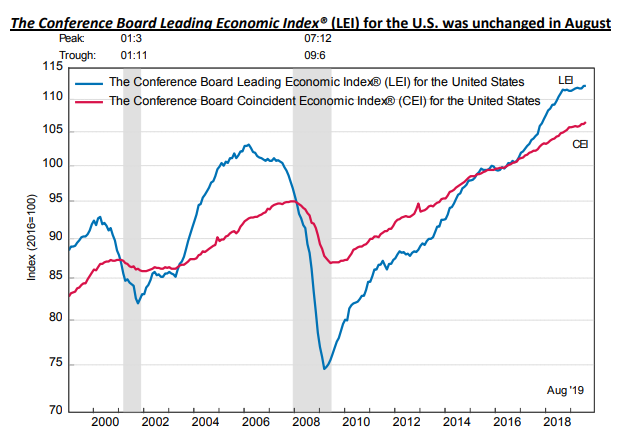
Chart of the Month: Are We in a Recession? By Kelly Pedersen, CFP® Whether or not the U.S. is going into a recession is on the minds of many of [...] READ MORE >

Chart of the Month: China’s Response to U.S. Tariffs by Kelly Pedersen, CFP® This month, the markets were sent reeling following news that China would raise tariff rates on $60 [...] READ MORE >
What is a Yield Curve and Why is Everyone Talking About It? by Kelly Pedersen, CFP® It happened, the yield curve inverted. Talking heads have made the topic go viral. [...] READ MORE >
2018 CAISSA Investment Review by Kelly Pedersen, CFP® This is my annual review of the markets for the year and where we might be going. It starts off with basic [...] READ MORE >
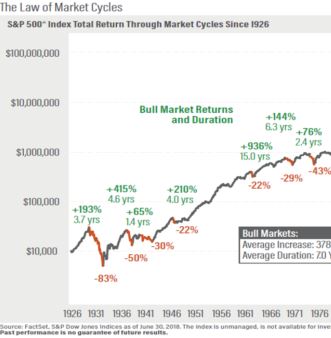
Chart of the Month: The Critical Element in Investing and Winning: Controlling Emotions Written by Kelly S. Olson Pedersen, CFP®, CDFA Here’s a little experiment. Look at the chart of [...] READ MORE >